

Most futures traders who struggle to improve share one common habit: they treat their trade records like a basic log. Date, instrument, profit or loss. Done. But understanding what is a trading journal futures traders actually need reveals something far more specific and powerful than a simple spreadsheet. A futures trading journal is a structured performance system built around contract math, session timing, and behavioral data. Get it right, and you have a feedback engine that compounds your edge over time. Get it wrong, and you are flying blind with false confidence.
Table of Contents
- Key takeaways
- What is a trading journal for futures: core data you must record
- Calculating P&L correctly using tick values and multipliers
- Advanced metrics and notes that deepen your analysis
- Review routines that turn your journal into a performance system
- My take on futures journaling: what actually works
- Put your journal to work with a funded futures account
- FAQ
Key takeaways
| Point | Details |
|---|---|
| Futures journals require contract math | Record tick size, tick value, and contract multiplier to calculate accurate dollar P&L. |
| Session timing changes your edge | Log precise timestamps to identify which trading sessions produce your best results. |
| MAE and MFE expose risk problems | These metrics reveal whether losses come from bad strategy or poor position sizing. |
| Review cadence drives improvement | Daily and weekly reviews turn raw data into performance patterns you can act on. |
| Decision quality beats outcome tracking | Separating process from result accelerates learning and strategy refinement. |
What is a trading journal for futures: core data you must record
A futures trading journal is not a generic trade log. It is a contract-specific performance record built to capture the unique mechanics of futures markets. That distinction matters because futures P&L is not calculated the same way as stocks or forex. Every field you record must reflect how futures contracts actually work.
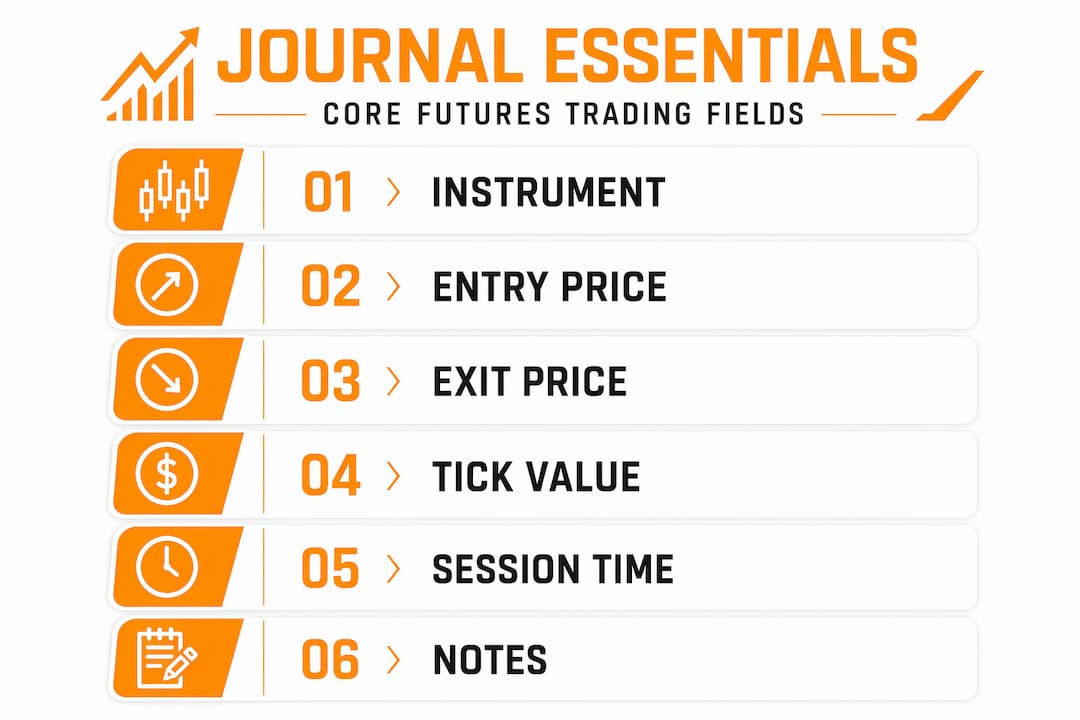
At minimum, every trade row in your journal needs these core fields:
- Instrument: The specific futures contract (ES, NQ, CL, GC, etc.)
- Entry price and exit price: Exact fill prices, not approximations
- Entry time and exit time: Down to the minute, not just the date
- Position size: Number of contracts traded
- Tick size: The minimum price increment for that contract
- Tick value: The dollar value of one tick move
- Contract multiplier (point value): The dollar value per full point move
- Gross P&L and net P&L: Calculated using contract math, not stock formulas
- Trade direction: Long or short
Why does this level of detail matter? Because same point move equals different dollar risk across contracts. A one-point move in ES equals $50. The same one-point move in NQ equals $20. If you are trading multiple instruments and not recording contract specs per trade, your performance comparison is meaningless.
Session timing is another field most traders skip. Futures markets trade nearly 24 hours, and market behavior in the overnight session looks nothing like the regular trading hours session. Recording your timestamps precisely lets you analyze whether your edge exists across all sessions or only during specific windows.
Pro Tip: If you trade more than one futures instrument, add a dedicated "contract specs" column or reference sheet so you never mix up tick values between instruments. Confusing the ES tick value with the NQ tick value will corrupt every P&L calculation in your journal.
Calculating P&L correctly using tick values and multipliers
This is where most futures journals break down. Traders carry over the stock formula (shares × price difference) and apply it to futures. The result is unreliable metrics that distort every performance statistic they track.

The correct formula for futures P&L is straightforward:
Gross P&L = (Exit Price − Entry Price) × Number of Contracts × Point Value
Here is how that works across three common instruments:
- E-mini S&P 500 (ES): Point value is $50. You buy 2 contracts at 5,200.00 and sell at 5,204.00. That is a 4-point move. P&L = 4 × 2 × $50 = $400 gross profit.
- E-mini Nasdaq-100 (NQ): Point value is $20. You buy 1 contract at 18,500.00 and sell at 18,510.00. That is a 10-point move. P&L = 10 × 1 × $20 = $200 gross profit.
- Crude Oil (CL): Point value is $1,000. You short 1 contract at 80.50 and cover at 80.20. That is a 0.30-point move. P&L = 0.30 × 1 × $1,000 = $300 gross profit.
The ES tick value of $12.50 (with a tick size of 0.25) is a useful sanity check. Four ticks equal one full point, so 4 × $12.50 = $50 per contract. If your journal shows a different number, something is wrong with your formula.
Why does this precision matter beyond just knowing your profit? Because every downstream metric depends on it. Your win rate is cosmetic. Your average R-multiple, your risk-adjusted return, your drawdown measurement. All of these are only as accurate as the P&L figures feeding them. Spreadsheet journaling often fails in futures precisely because traders do not build in the contract multiplier step, and the errors compound silently over weeks of trading.
Advanced metrics and notes that deepen your analysis
Recording entry, exit, and P&L gets you started. But a futures trading journal that only captures those fields tells you what happened. It does not tell you why or whether your process was sound. That is where advanced metrics and qualitative notes become the real differentiator.
The two most underused metrics in any futures journal are MAE and MFE.
- MAE (Maximum Adverse Excursion): The largest unrealized loss the trade reached before closing. If your MAE is consistently larger than your stop loss, your stops are too tight and you are getting shaken out of valid trades.
- MFE (Maximum Favorable Excursion): The largest unrealized gain the trade reached before closing. If your MFE is consistently much larger than your actual exit, you are leaving significant profit on the table by exiting too early.
MAE and MFE help diagnose whether your losses are a strategy problem or a risk sizing problem. That is a critical distinction. A trader with a 40% win rate and tight MAE relative to stops has a different problem than a trader with the same win rate but wide MAE. The journal tells you which one you are.
Beyond those metrics, your journal should include:
- Setup tag: A short label for the pattern or condition that triggered the trade (e.g., "breakout retest," "opening range break," "VWAP reclaim")
- Execution quality score: Rate your entry and exit on a 1 to 5 scale based on how well you followed your plan
- Mental state note: One sentence on your emotional state before the trade. Were you calm, impatient, revenge trading?
- Outcome vs. decision quality: A binary field. Was this a good trade based on your process, regardless of whether it won or lost?
That last field is the one most traders resist. Separating decision quality from outcomes is uncomfortable because it forces you to acknowledge that a losing trade can be a good trade, and a winning trade can be a reckless one. But this separation is what accelerates learning faster than any other journaling habit.
Pro Tip: Build a setup library alongside your journal. Each time you tag a setup, link it to a brief description of the exact conditions required. Over time, you will see which setups have positive expectancy and which ones you should stop trading entirely.
Review routines that turn your journal into a performance system
A journal unused is just a diary. The data you collect only creates value when you review it with structure and intent. Here is a review cadence that works for active futures traders:
- Daily review (5 to 10 minutes after the session closes). Pull up each trade from the day. Confirm your P&L calculation is correct. Score your execution quality. Add any notes on market conditions or mental state you did not capture in real time. Flag any trades that felt off for deeper weekly review.
- Weekly review (20 to 30 minutes, ideally on the weekend). Calculate your win rate, R-multiples, and worst trading hours for the week. Sort trades by setup tag and compare average P&L per setup. Look at your MAE and MFE data to spot patterns in your exits and stops. Identify your two best trades and your two worst. Write one sentence on what each group has in common.
- Monthly review (45 to 60 minutes). Compare this month's metrics to the prior month. Has your execution quality score improved? Are your worst hours consistent? Is one setup tag responsible for most of your losses? This is where you make actual rule changes to your trading plan based on evidence.
Session timing analysis deserves special attention during weekly reviews. Because futures trade nearly around the clock, your journal will reveal whether your edge is concentrated in the first hour of the regular session, the overnight session, or the afternoon. Many traders discover they are profitable in one window and net negative in another. Cutting the losing sessions alone can transform a break-even trader into a consistently profitable one.
My take on futures journaling: what actually works
I have reviewed a lot of trading journals, and the pattern is consistent. Traders who struggle with journaling are not lazy. They are recording the wrong things and reviewing with no structure. The journal becomes a chore with no payoff, so they stop.
What changed my perspective was tracking session timing seriously. I started logging whether each trade happened in the pre-market, the regular session open, or the afternoon. Within three weeks, it was obvious that my afternoon trades were dragging my overall performance down significantly. I was not a bad trader in the morning. I was a bad trader after 1 PM Eastern. Cutting afternoon trading was one of the highest-impact decisions I made, and the journal data made it undeniable.
The other shift was treating disciplined journaling routines as a non-negotiable part of the trading day, not an optional add-on. Five minutes after every session. Twenty minutes on Sunday. That rhythm compounds. After 90 days, you have enough data to make real decisions about your strategy.
The traders I see succeed with futures journals are not the ones with the most elaborate spreadsheets. They are the ones who review consistently and act on what they find.
— Amos
Put your journal to work with a funded futures account
If your journal is showing you a repeatable edge, the next logical step is trading it with real capital behind you. Instantfuturestrading gives you instant access to funded accounts with no evaluation phase and no challenge to pass. You get live CME market data across 40+ instruments, a 90% performance reward split, and the ability to stack up to 20 accounts simultaneously.
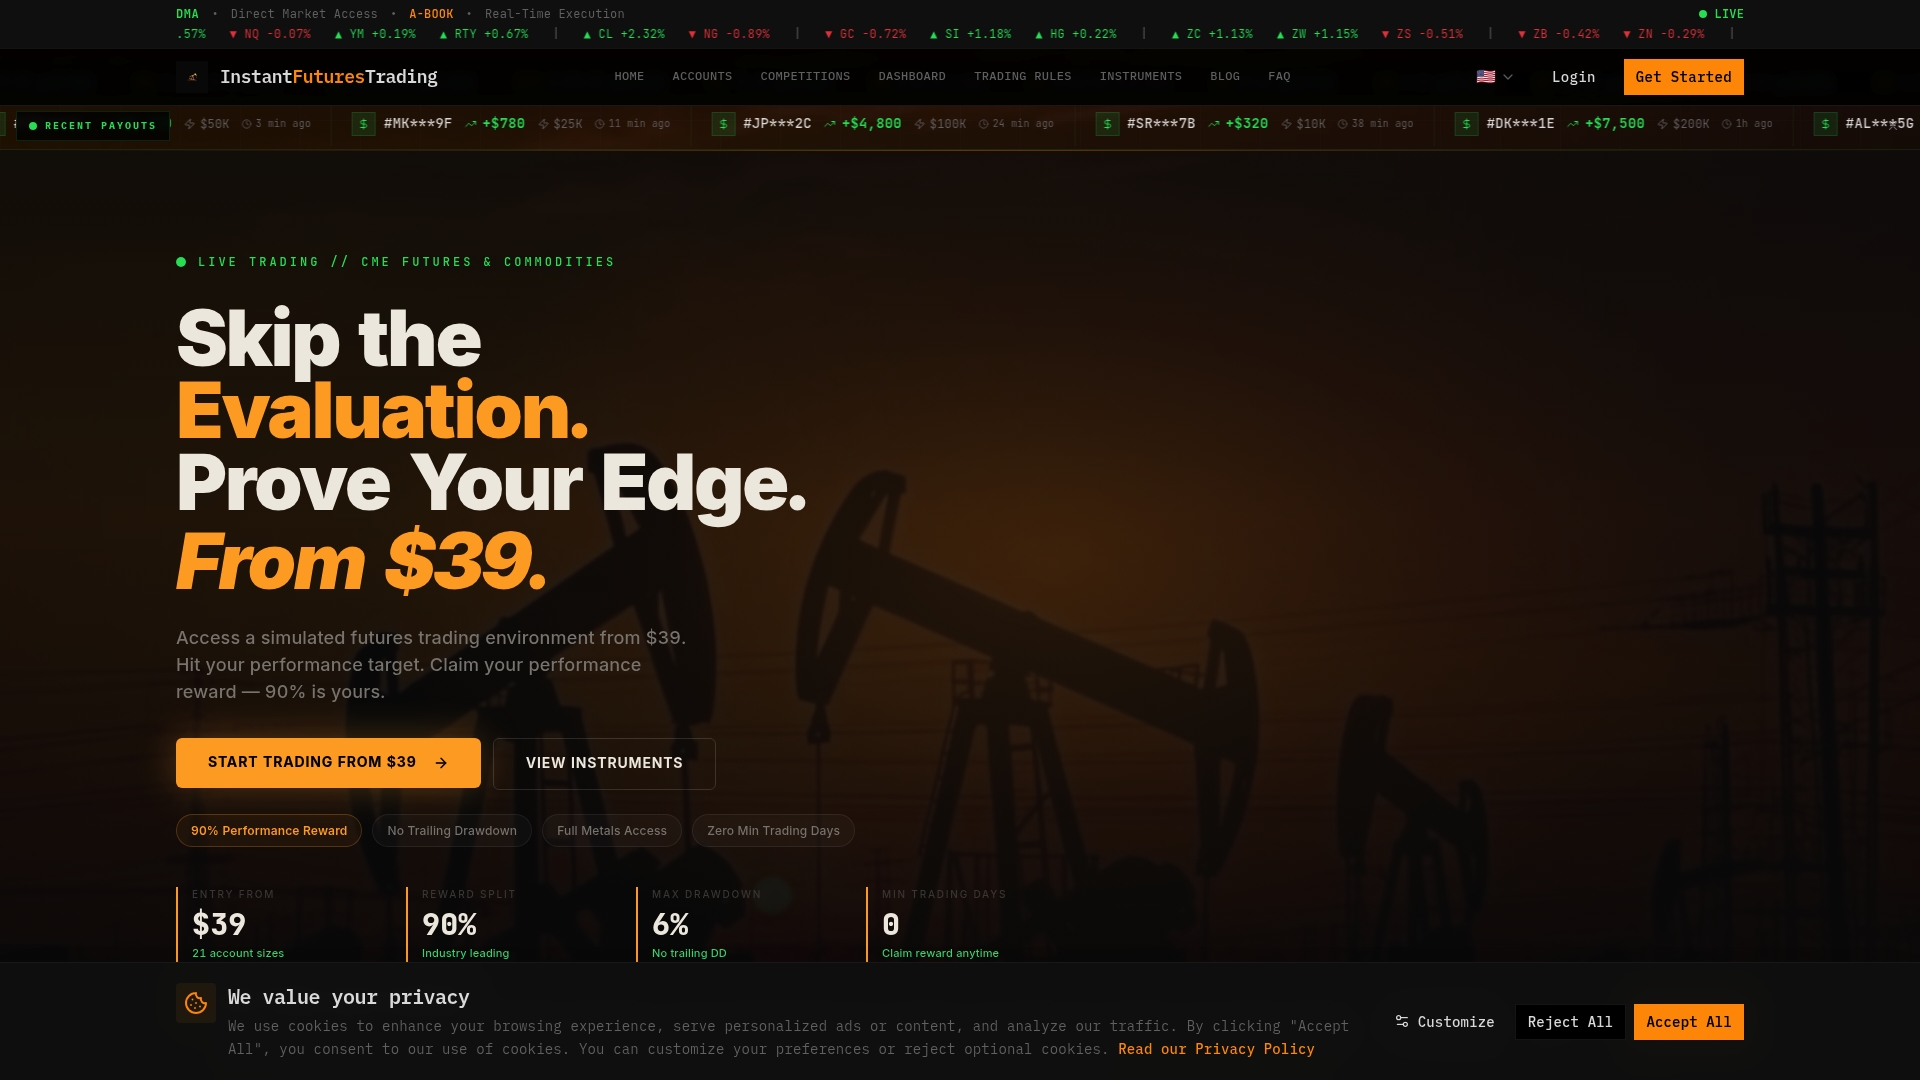
Your journal tells you where your edge lives. Instantfuturestrading gives you the capital to act on it. Accounts start from $39 with no monthly fees, no trailing drawdown, and no minimum trading days. Explore your funded account options and start applying what your data is already telling you.
FAQ
What is a futures trading journal?
A futures trading journal is a structured record of your futures trades that captures contract-specific data including tick value, contract multiplier, session timing, MAE, MFE, and qualitative notes. Unlike a generic trade log, it is built to calculate accurate dollar P&L and identify performance patterns specific to futures markets.
What should I include in a futures trading journal?
At minimum, include instrument, entry and exit price, entry and exit time, position size, tick size, tick value, point value, gross P&L, and trade direction. Advanced fields like MAE, MFE, setup tags, execution quality scores, and mental state notes significantly deepen your analysis.
How do I calculate P&L correctly in a futures journal?
Use the formula: (Exit Price minus Entry Price) × Number of Contracts × Point Value. For ES, the point value is $50. For NQ, it is $20. Applying a stock-style formula without the contract multiplier produces incorrect P&L figures that corrupt all your downstream metrics.
How often should I review my futures trading journal?
A daily review of 5 to 10 minutes covers execution quality and P&L verification. A weekly review of 20 to 30 minutes analyzes win rates, R-multiples, and session performance. Monthly reviews identify rule changes based on accumulated evidence.
What are MAE and MFE in a trading journal?
MAE (Maximum Adverse Excursion) measures the largest unrealized loss a trade reached before closing. MFE (Maximum Favorable Excursion) measures the largest unrealized gain before closing. Together, they diagnose whether your losses stem from strategy flaws or risk sizing problems.